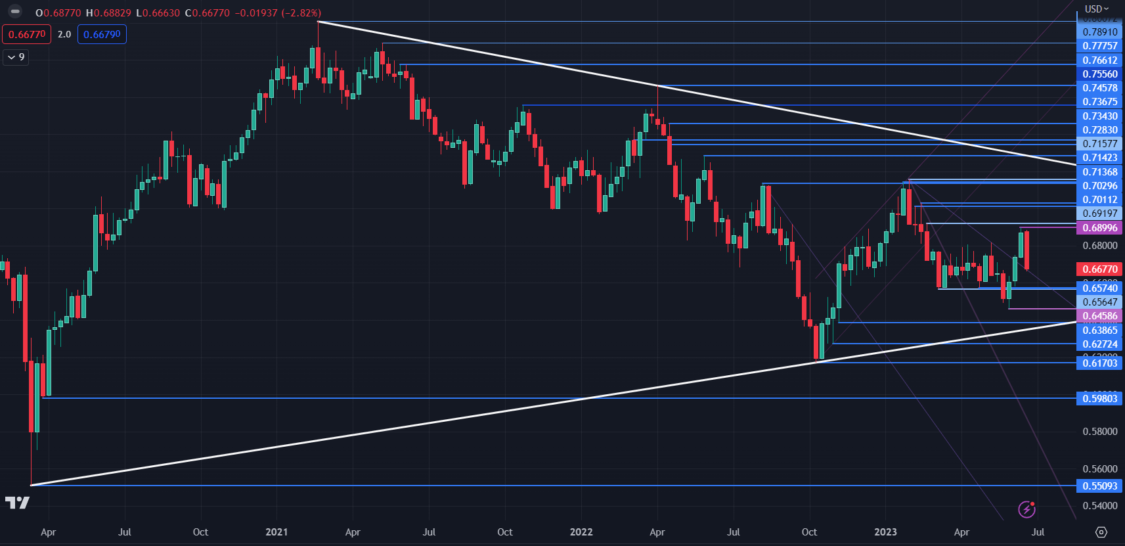
One of the many common features of the asset classes in 2023 is a range trading type of environment. An example of such would be AUD/USD forecast. Halfway through the year, the Aust dollar is not even close to testing the waters of 2022 high or low at approximately 0.7660 and 0.6170.
The Asymmetric Triangle AUD/USD forecast:
Looking at the larger picture, during the pandemic’s starting point, the AUD/USD forecast hit a low at 55 US cents before recovering to trade over 80 US cents as a result of government and central bank policy actions. An asymmetric triangle has formed as it traded back and forth within these limitations.
A falling trendline on the top side and an ascending trendline on the bottom create the triangle. Given the timeframe in the chart below that depicts this pattern, the AUD/USD forecast might trade within the triangle for a lengthy period. This would keep the trading environment in the range.
On the other hand, a break on either side of the asymmetric triangle may cause momentum to shift in that direction. Meanwhile, historical highs, lows, and breakpoints may be levels to monitor. For reference, see the right-hand side of the chart below.

By Dan McCarthy TradingView
Range Trade – AUD/NZD
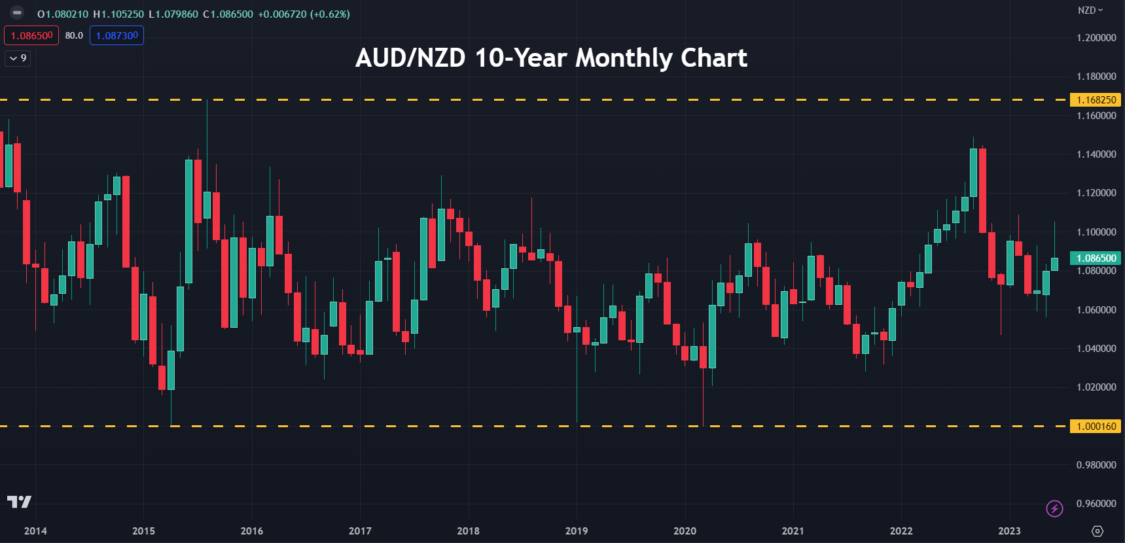
It is not a shock that AUD/NZD is commonly referred to as a range trading currency pair, given that the two have a lot of similarities. It has fluctuated between 1.0000 and 1.1700 range for the past ten years.
Closely analyzing the weekly chart shows that AUD/NZD has dropped below the 52-week Simple Moving Average (SMA)—usually, the cross of the SMA signals underlying momentum.

If short-term bearish momentum persists, support might be found at the preceding lows of 1.0560, 1.0470, 1.0360, 1.0315, and 1.0280. Resistance might be at the breakpoints and prior high around 1.1050, 1.1090, 1.1175, 1.1240, or 1.1490 if the price breaks back above the 52-week SMA and bullish momentum develops.
AUD/NZD Weekly Chart

By Dan McCarthy TradingView

