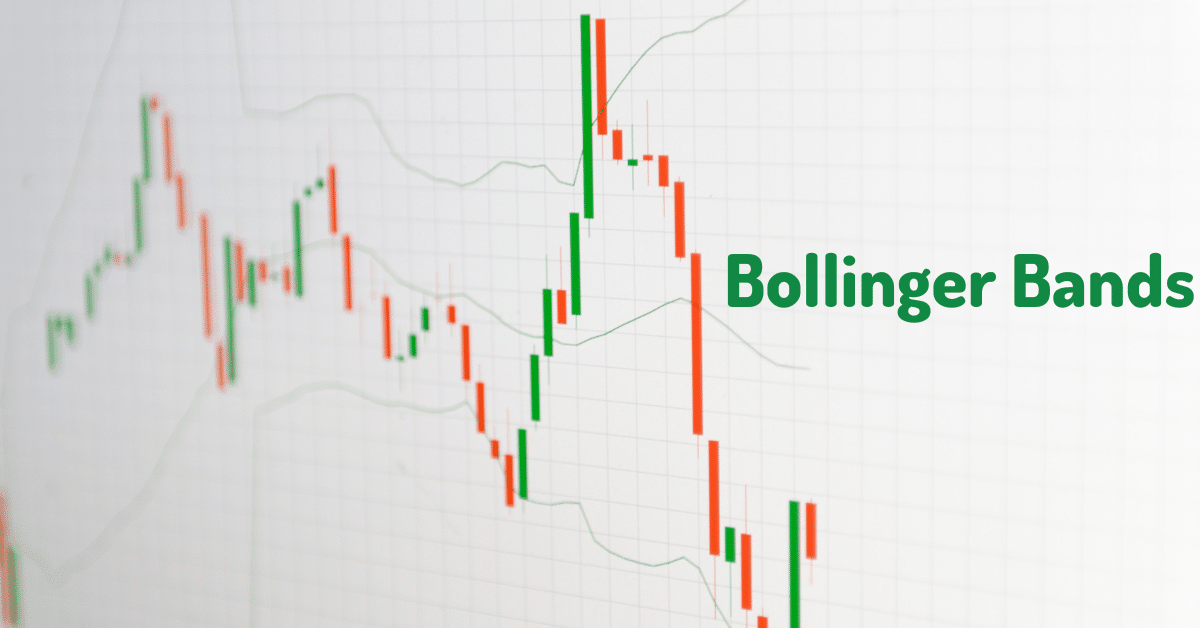
Bollinger Bands is a type of technical analysis tool consisting of a moving average and two standard deviation lines plotted two standard deviations away from the moving average, creating an upper and lower band. This tool helps to identify potential overbought or oversold conditions in an asset and can also be used to measure volatility. Traders use Bollinger Bands to determine possible buy and sell signals in a market.

How are Bollinger bands calculated?
Bands are calculated as follows:
- The middle line: A simple moving average (SMA) of the asset’s price is plotted over a specific time period, usually 20 periods.
- The upper band: The upper band is plotted two standard deviations above the moving average.
- The lower band: The lower band is plotted two standard deviations below the moving average.
To calculate the standard deviation, the average difference between each data point and the moving average is taken and then multiplied by two. This provides an estimate of the volatility of the asset’s price over the specified time period.
The formula for calculating the upper band is:
Upper Band = Moving Average + (2 x Standard Deviation)
The formula for calculating the lower band is:
Lower Band = Moving Average – (2 x Standard Deviation)
How is a Bollinger band read?
Reading the bands involves analyzing the position of the asset’s price in relation to the bands. There are a few key aspects to look for:
- Volatility: The distance between the upper and lower bands will increase during periods of high volatility and decrease during periods of low volatility.
- Overbought/oversold: If the price of an asset touches or moves outside the upper band, it may be considered overbought and could be a potential sell signal. If the price of an asset touches or moves outside the lower band, it may be regarded as oversold and could be a potential buy signal.
- Trend: If the price of an asset is trending up, it will often stay between the upper and lower bands. If the price is trending down, it will often fall below the lower band.
It’s important to note that Bollinger Bands are just one tool in a trader’s tool kit and should be used alongside other indicators and analysis techniques to get a comprehensive picture of market conditions.
Is it helpful for predicting future prices?
Bollinger Bands are not designed to predict future prices but to help identify potential overbought or oversold conditions and measure volatility. While they can provide some insight into market conditions and potential price action, they are not a guarantee of future price movement and should not be used as a standalone tool for making investment decisions.
In general, technical analysis is based on the idea that historical price and volume data can provide information about future market behavior. However, it’s important to keep in mind that past performance is not necessarily an indicator of future results and that many factors can influence market prices, including economic news, geopolitical events, and investor sentiment.
It’s always a good idea to use a combination of technical and fundamental analysis when making investment decisions and to have a well-diversified portfolio to manage risk.
Is Bollinger Band a good indicator?
Bollinger Bands can be useful in certain market conditions, but they should not be relied upon as a sole indicator for making investment decisions. Like all technical analysis tools, these Band’s are limited and can provide false signals in certain market conditions.
Bollinger Bands are most reliable when used with other technical indicators and analysis tools. It’s also important to consider fundamental factors, such as economic data and company earnings.
It’s worth noting that no technical analysis tool can guarantee future market performance and that all investments carry a certain level of risk. Keeping a well-diversified portfolio and regularly reviewing and adjusting your trading strategy based on market conditions and your personal financial goals is essential.
How accurate is Bollinger Bands?
The accuracy of Bollinger Bands as an indicator depends on a variety of factors, including market conditions and the time frame being used.
No technical analysis tool can provide a guarantee of accuracy, and the markets are inherently unpredictable. Bollinger Bands can be a useful tool for traders, but it’s important to use a combination of technical analysis and fundamental analysis, and to regularly review and adjust your trading strategy based on market conditions and your personal financial goals.
What is the best setting for Bollinger Bands?
There is no universally “best” setting for Bollinger Bands as it ultimately depends on the individual trader’s style, market conditions, and personal preferences. However, here are some common settings that are widely used:
- Time frame: Bollinger Bands can be used on different time frames, including daily, weekly, and monthly charts. The time frame selected will depend on the trader’s investment horizon and the volatility of the market being traded.
- Band width: Bollinger Bands are usually set with a 20-day moving average and a standard deviation of 2. Some traders adjust the band width based on market conditions, widening the bands during periods of high volatility and narrowing them during periods of low volatility.
- Moving average type: Bollinger Bands can be calculated using a simple moving average (SMA) or an exponential moving average (EMA). The choice between SMA and EMA will depend on the individual trader’s preferences.
Closing Thoughts
In conclusion, Bollinger Bands are a popular technical analysis tool used by traders to help identify potential overbought or oversold conditions and measure market volatility. While they can be useful, they should not be relied upon as a sole indicator for making investment decisions. The accuracy of Bollinger Bands depends on a variety of factors, including market conditions and the time frame being used. The best settings for Bollinger Bands will depend on the individual trader’s style, market conditions, and personal preferences. It’s important to use Bollinger Bands in conjunction with other technical indicators and analysis techniques, and to regularly review and adjust your strategy based on market conditions and your personal financial goals.
Best Technical Analysis Indicators