What are the best technical analysis indicators? Technical analysis is an indispensable aspect of trading and investing, providing valuable insights into market trends and informing decision-making. Its rich history spanning centuries has evolved into a diverse field with numerous indicators and methodologies. In this profound guide, we will explore the fascinating history of technical analysis, delve into its fundamental principles, and discuss various types of technical analysis indicators that can be employed to enhance trading strategies and outcomes.
These indicators serve as tools to analyze historical data and predict future price movements. While each analyst may have their preferred indicators, we will focus on the most common ones that are effective for day traders, swing traders, and investors. By understanding and utilizing these indicators, traders can make more informed decisions based on market analysis, improve their timing, and potentially increase their trading success.
The History of Technical Analysis
The history of technical analysis is rooted in the 17th century with the development of candlestick charting by Japanese rice traders. This visual method of analyzing price patterns laid the groundwork for future techniques. In the early 20th century, Charles Dow and Richard W. Schabacker made significant contributions to the field. Dow formulated the Dow Theory, emphasizing the importance of price movements, trends, and market cycles. Schabacker’s book, “Technical Analysis and Stock Market Profits,” published in 1932, provided a comprehensive framework for technical analysis, introducing chart patterns, trend analysis, and other indicators.
Since then, technical analysis has continuously evolved alongside technological advancements and data analysis. The availability of computing power, statistical tools, and data visualization has further enhanced the practice of technical analysis. Today, it has become an essential tool traders and investors use worldwide. Whether employed by individuals or institutions, technical analysis plays a crucial role in understanding market behaviour, identifying patterns, and making informed trading decisions. As the financial markets continue to evolve, technical analysis will likely adapt and incorporate new methodologies to meet the ever-changing needs of traders and investors.
What is Technical Analysis
At its core, technical analysis is based on the belief that historical market data can provide valuable insights into future price movements. It operates on the assumption that market prices follow specific patterns and trends, which can be identified and exploited for profit.
The central premise of technical analysis is that market fundamentals are already reflected in the price, rendering the analysis of historical price data essential to understanding market behaviour. By examining patterns, trends, support and resistance levels, and other indicators, technical analysts aim to predict future price shifts and make informed trading decisions.
What are the Best Technical Analysis Indicators?
Regarding technical analysis, a vast array of indicators is available to traders, offering valuable insights into market trends and helping guide their decision-making process. These indicators are designed to analyze various aspects of price movements, volume, momentum, and volatility. Let’s explore some of the key types of technical analysis indicators and how they can be utilized to enhance trading strategies.
1. Momentum indicators
Those indicators oscillate between overbought and oversold levels, helping traders identify potential reversal points. These indicators provide insights into market momentum and the likelihood of price exhaustion. Among the widely recognized oscillators utilized in technical analysis are the RSI – Relative Strength Index, the Stochastic Oscillator indicator, and the MACD – Moving Average Convergence Divergence.
What is Relative Strength Index?
RSI is one of the best technical analysis indicators representing whether the asset was overbought or oversold. This is by measuring the magnitude of price trends that the asset has experienced most recently. RSI is a momentum indicator; therefore, if it increases while the asset price goes up, the uptrend will be strong. This is because more buyers are investing in and investing or buying. Vice versa is true as well. If the momentum is on a downtrend while the price increases, then market sellers can control the market.

Let’s understand what is overbought or oversold in RSI. If the RSI is over 70, the asset is overbought, and under 30 is oversold. As a result, extreme values may indicate a trend reversal or pullback. Nonetheless, it may be best not to consider these values as direct buy or sell signals. The RSI can give off misleading signs like other technical analysis (TA) techniques. Looking at other factors before entering a trade is always a good idea.
What is Moving Average Convergence Divergence?
The MACD determines a specific asset’s momentum by showing the connection between two moving averages. MACD correlates with two lines, the first being the MACD line and the second being the signal line. The differences between the MACD and price action can give traders a view of the strengths of the current market trends. Traders can also use some of these best technical analysis indicators to look for crossovers between the MACD line and its signal line. The MACD is frequently used with the RSI because they measure momentum differently. Combined, they will provide a more comprehensive technical outlook on the market.
What is Stochastic Oscillator?
The Stochastic Oscillator is a widely used technical analysis tool that helps traders identify overbought and oversold conditions in the market. It consists of two lines, %K and %D, oscillating between 0 and 100. Traders use this indicator to generate signals and spot potential reversal points in price trends. By incorporating the Stochastic Oscillator into their analysis, traders gain insights into the strength and direction of price movements. However, using this tool in conjunction with other indicators and considering the overall market context before making trading decisions is important.
2. Trend Indicators
Trend indicators help traders identify the direction and strength of price trends. They analyze price data to determine if the market is bullish, bearish, or consolidated. Common trend indicators include moving averages, trend lines, and the Average Directional Index (ADX). These tools assist traders in identifying entry and exit points, following market trends, and avoiding counter-trend trades. While no indicator can guarantee accuracy, understanding and using trend indicators can enhance trading outcomes.
What is Moving Average?
One of the best technical analysis indicators is the moving average, which effectively filters out market noise and highlights the trend by smoothing out price movements. However, it’s important to remember that moving averages are based on past price data, making them a lagging indicator. As such, traders should be mindful of the limitations of using moving averages and supplement their analysis with an additional indicator from the list of best technical analysis indicators to achieve a more well-rounded understanding of the market.
Two of the most common moving averages are SMA or MA and EMA. What’s the difference between the two? SMA takes price data from a certain period and gets the average. On the other hand, the EMA gives more attention to recent price data. Traders frequently use the price’s relation to specific moving averages to determine the current market trend. In addition, traders use moving averages to signal to buy or sell.

What is Trend Lines?
Trend lines are graphical tools used in technical analysis to represent a market trend’s direction and slope visually. They are drawn by connecting consecutive highs or lows on a price chart. Trend lines help traders identify support and resistance levels, determine trend reversals, and make informed trading decisions. A rising trend line indicates an uptrend, while a descending trend line indicates a downtrend. Traders often look for breakouts or bounce off trend lines as potential trading opportunities.
What is Average Directional Index (ADX)?
The Average Directional Index (ADX) is a valuable technical tool for evaluating the strength of a market trend, enabling traders to determine the robustness of price movements. It consists of three lines: the ADX line, the Positive Directional Indicator (+DI), and the Negative Directional Indicator (-DI). The ADX line indicates the trend’s strength, with higher values indicating a stronger trend. The +DI and -DI lines help determine the direction of the trend. Traders use the ADX to identify trending markets, assess trend strength, and potentially filter out trades during periods of low volatility or consolidation. A rising ADX suggests a strengthening trend, while a declining ADX may indicate a weakening trend or a range-bound market.
3. Volume Indicators
Volume indicators in technical analysis provide insights into trading activity. They help traders assess the strength and confirmation of price movements and identify potential reversals. Common volume indicators include Volume Weighted Average Price (VWAP), On-Balance Volume (OBV), and Chaikin Money Flow (CMF). These indicators analyze volume patterns to enhance trading strategies and provide valuable information about market dynamics and the relationship between price and volume.
What is Volume Weighted Average Price (VWAP)?
A widely used indicator in trading and investing. It provides traders with valuable insight into the average cost of a security over a specific period, considering the volume of trades at each price level. VWAP is especially popular among institutional traders who execute large orders, as it helps them assess whether their trades were executed at favourable prices. It is often used as a benchmark for evaluating the performance of a trade or investment strategy.
What is On-Balance Volume (OBV)?
This volume-centric indicator provides traders with valuable insights into trend strength and potential trend reversals. It considers the accumulated volume of a security during a defined period. It assigns positive values to the indicator when the closing price surpasses the previous close, while negative values are assigned when it is lower. By tracking the OBV line, traders can ascertain the predominant volume flow into or out of a security, confirming a trend’s strength or indicating the possibility of a trend reversal.
What is Chaikin Money Flow (CMF)?
Utilizing price and volume data, the Chaikin Money Flow (CMF) is a technical indicator to gauge the inflow and outflow of money in security. Its objective is to assess the strength of buying and selling pressure. CMF calculates the volume of each period, multiplied by the accumulation or distribution factor derived from the closing price and price range. When CMF is positive, it indicates money flowing into the security, indicating buying pressure. Conversely, a negative CMF suggests money flowing out, implying selling pressure.
4. Volatility Indicators
Those indicators are technical analysis tools that measure the degree of price fluctuations in the market. They provide insights into the volatility or price variability of a financial instrument. Volatility indicators help traders identify high or low volatility periods, anticipate potential trend reversals, and determine the appropriate levels for setting stop-loss orders and take-profit targets. Some commonly used volatility indicators include Bollinger Bands, Average True Range (ATR), and the VIX (Volatility Index). By understanding and analyzing volatility, traders can adjust their strategies and risk management techniques accordingly, maximizing their profit potential while minimizing potential losses.
What is a Bollinger Bands?
A popular volatility indicator created by John Bollinger. They consist of three lines plotted on a price chart: a middle band, an upper band, and a lower band. The middle band of the indicator is commonly set as the simple moving average (SMA), serving as a reference point for the average price. In contrast, the upper and lower bands are determined using the price’s standard deviation. Bollinger Bands dynamically adjust to market conditions, expanding during periods of high volatility and contracting during periods of low volatility. Traders use Bollinger Bands to identify price extremes, detect potential breakouts or reversals, and assess the likelihood of price continuation within a range.
What if Average True Range (ATR)?
Average True Range (ATR): This technical indicator developed by J. Welles Wilder Jr. measures a financial instrument’s average price range or volatility over a specified period. ATR takes into account the true range, which is the greatest of the following: the difference between the current high and low prices, the absolute value of the contrast between the recent high and the previous close, or the whole value of the difference between the current low and the previous close. Traders use ATR to assess market volatility, set appropriate stop-loss levels, and determine potential profit targets. Higher ATR values indicate higher volatility, while lower ATR values suggest lower volatility.
What is Volatility Index (VIX)?
The VIX, also known as the “fear gauge,” is a popular measure of market volatility and investor sentiment. It is calculated based on the prices of options on the S&P 500 index. The VIX reflects the market’s expectation of future volatility over the next 30 days. When the VIX is high, it suggests heightened fear and uncertainty in the market, indicating a higher likelihood of sharp price movements. Conversely, a low VIX indicates a more stable and complacent market environment. Traders and investors use the VIX as a contrarian indicator, with high readings potentially signalling buying opportunities during market downturns and low readings indicating potential complacency or overconfidence in the market.
5. Pattern recognition indicators
These types of indicators are technical analysis tools that identify chart patterns formed by price movements. These patterns can indicate potential trend reversals or continuations, helping traders make informed decisions. They include patterns like triangles, double tops/bottoms, head and shoulders, and flags. These indicators can be automated or manual, providing additional information such as target price and stop-loss levels. Traders should use them alongside other analysis methods and consider market conditions for informed decision-making.
What is The head and shoulders pattern?
This pattern is a reversal pattern that typically signals a bullish-to-bearish trend reversal. The pattern features three distinct peaks, with the middle peak (known as the head) standing taller than the two surrounding peaks (referred to as the shoulders). Traders commonly perceive this pattern as a signal that the upward momentum of the bullish trend is diminishing, potentially leading to a subsequent bearish trend.
What is The double tops pattern?
The pattern is also a reversal pattern, indicating a potential change from a bullish trend to a bearish one. It forms when the price reaches a resistance level, pulls back, and then retests the same resistance level but fails to break through. This failure to break the resistance level twice forms two peaks of approximately equal height, signalling a possible trend reversal.
What is Triangles patterns?
Triangles are chart patterns representing a consolidation period before a potential breakout or breakdown. There are three main types of triangles: ascending, descending, and symmetrical. Ascending triangles show a bullish bias, with a horizontal resistance line and an upward-sloping trendline. Descending triangles indicate a bearish bias, with a horizontal support line and a downward-sloping trendline. Symmetrical triangles have converging trendlines and suggest a potential breakout in either direction.
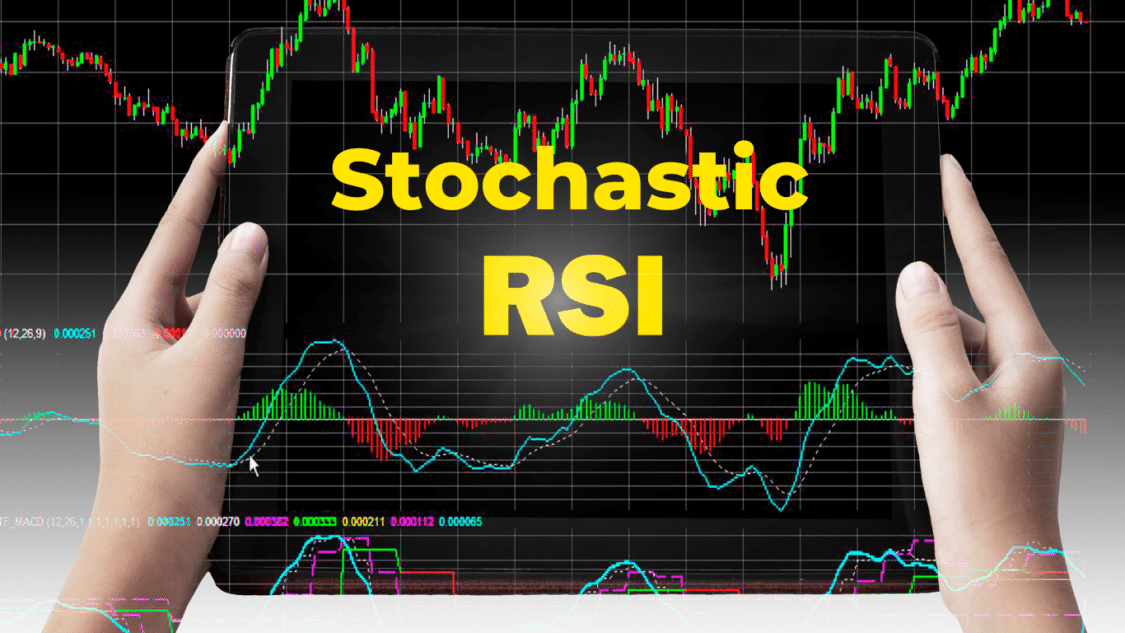
What is The Stochastic RSI
Integrating both the Relative Strength Index (RSI) and the Stochastic Oscillator, the Stochastic RSI offers traders a comprehensive and holistic assessment of market conditions. This comprehensive analysis aids in making informed decisions by considering multiple market aspects. While the RSI measures momentum and strength, indicating overbought or oversold levels, the Stochastic Oscillator identifies potential reversal points based on the current closing price relative to its price range. By incorporating these indicators, the Stochastic RSI offers insights into overbought or oversold conditions and potential trend reversals.
Traders commonly utilize the Stochastic RSI to identify entry and exit points. It generates signals when crossing certain threshold levels or showing divergence with price movements. Oversold conditions (low values) suggest buying opportunities, while overbought conditions (high values) may indicate selling or shorting positions. However, combining the Stochastic RSI with other technical analysis tools is crucial, considering market context, trend analysis, and supporting indicators to confirm signals and make well-informed trading decisions.
Widely regarded as one of the best technical analysis indicators, the Stochastic RSI functions similarly to the RSI but incorporates the Stochastics oscillator formula into the RSI values. This nuanced approach enhances traders’ understanding of market conditions. A StochRSI value above 0.8 is considered overbought, while a value below 0.2 indicates oversold conditions. A value of 0 signifies the lowest point of the RSI during the measured period, while a value of 1 represents the highest point.
It is important to note that StochRSI is a more sensitive indicator than RSI, which means it can produce more false or misleading signals. Therefore, using the Stochastic RSI in conjunction with other indicators and exercising caution when interpreting its signals is advisable.
Conclusion
When using technical analysis indicators, it’s essential to remain objective and aware of personal biases. Traders should consider their trading style, time horizon, and the market they are analyzing. By evaluating multiple indicators and understanding their relationships, traders can comprehensively understand market conditions. Technical analysis provides various tools to analyze and predict market behaviour, but no single indicator guarantees precise predictions.
To make well-informed trading decisions when choosing between the best technical analysis indicators , traders should combine technical analysis with other forms of analysis and implement effective risk management strategies. Adopting a multifaceted approach helps navigate market complexities and improve outcomes. By staying objective, using multiple tools, and managing risk, traders can enhance their decision-making process and overall trading success.
For more news updates, visit our homepage now and see our latest news article. Want to learn more about trading? Visit our education page now and learn for FREE!
7 Common Mistakes of Technical Analysis(Opens in a new browser tab)
PacSun Goes Crypto(Opens in a new browser tab)
Reasons Why Forex Traders Lose Money(Opens in a new browser tab)