
Fibonacci Retracement got his name after his creator Leonardo of Pisa he was an Italian mathematician born in the late 12th century. He is considered one of the significant mathematicians of the Middle Ages and is best known for introducing the Hindu-Arabic numeral system to the Western world. This system, which is still in use today, made it much easier to perform mathematical calculations compared to the Roman numeral system used at the time.
In this article we will explain how to trade Fibonacci retracement?
Fibonacci traveled extensively throughout the Mediterranean and learned various mathematical concepts and techniques from the Arabic world. In his book, “Liber Abaci,” published in 1202, he presented these concepts to the Western world. He introduced the Fibonacci sequence, a series of digitals in which each number is the sum of the previous two.
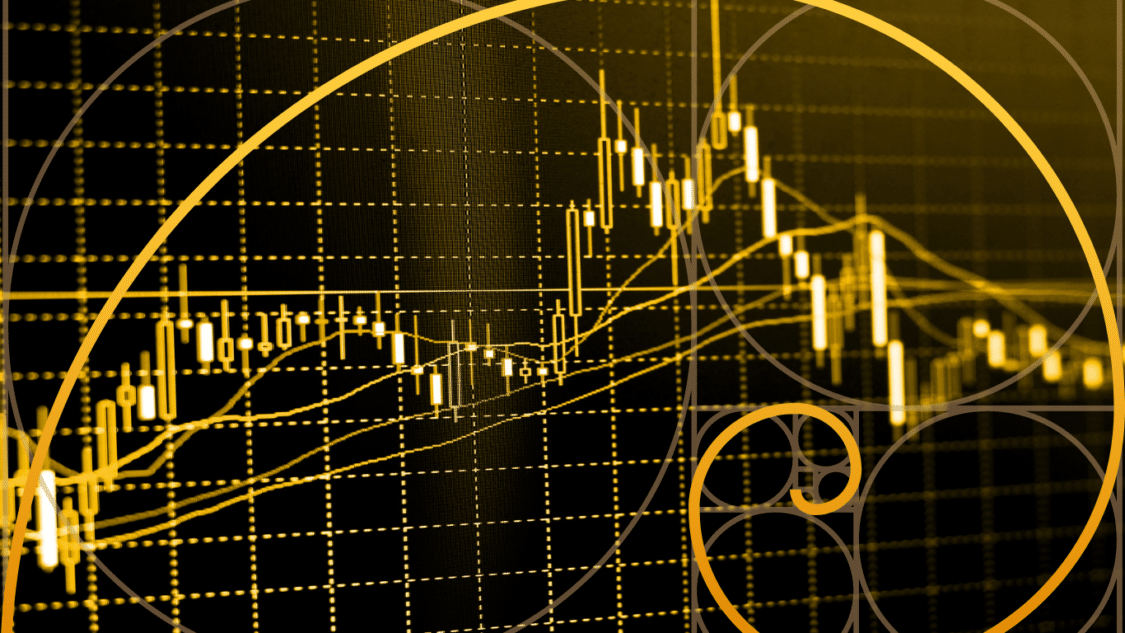
This sequence is based on the golden ratio, a mathematical constant that appears in many natural and manufactured forms. This ratio is approximately equal to 1.618 and is considered a natural growth pattern that is evident in the growth of leaves on a stem, the branching of trees, the shape of galaxies, and many other natural phenomena.
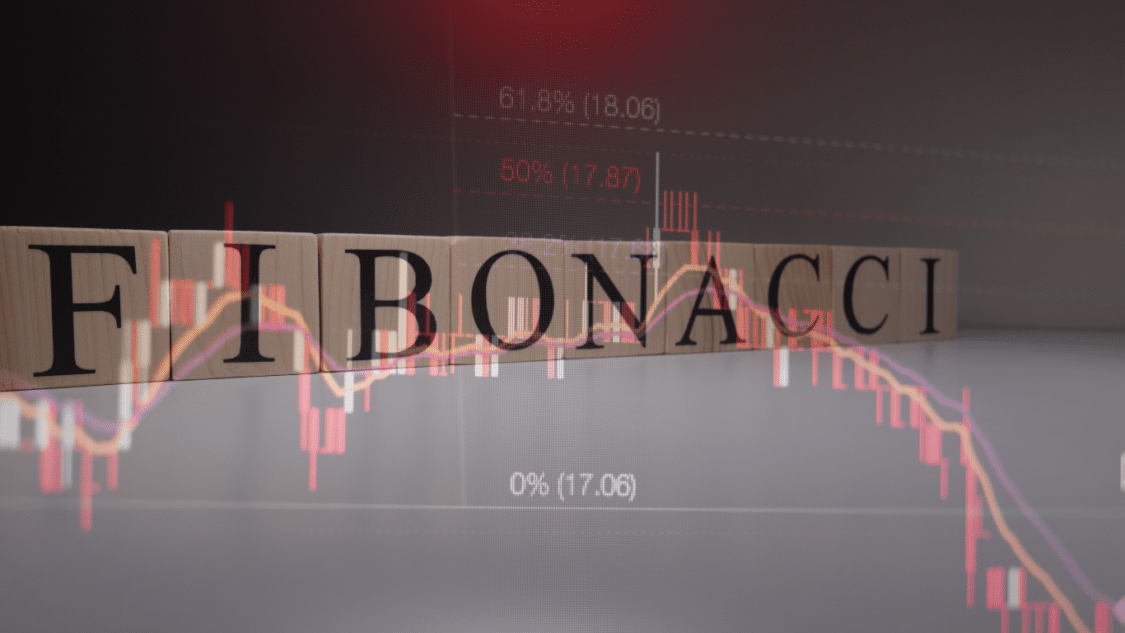
The concept of that sequence and the golden ratio has been used in many fields, including finance. Financial traders and analysts interested in identifying potential support and resistance levels in a company price movement developed this retracement tool. The tool plots the high and low of a particular price move. Then it divides the vertical distance by key Fibonacci ratios (23.6%, 38.2%, 50%, 61.8%, and 100%) to identify potential support and resistance levels.
Why are Fibonacci retracements important?
It has become a widely used technical analysis tool in the financial markets, and many traders consider it an essential part of their trading toolkit. The agency provides traders with a way to identify areas where an asset’s price may find support or resistance and can be used with other technical analysis tools. Like as trend lines and moving averages, to provide a complete picture of an asset’s price action.
The levels of it are often used to determine where an asset’s price might experience support or resistance as it retraces a portion of an original move. If an asset’s price increases and begins to pull back, the 61.8% or 50% retracement level might act as support, meaning the asset’s price could bounce from that level and continue to move higher. On the other hand, if an asset’s price decreases and starts to rally, the 38.2% or 23.6% retracement level might act as resistance, meaning the asset’s price could stall or even reverse at that level.
Advantages of Fibonacci retracement:
- Flexibility: It’s levels can be applied to different markets and time frames, providing traders with a flexible tool tailored to their specific needs.
- Widely used: It is a widely followed technical analysis tool, so the levels it generates can be a self-fulfilling prophecy.
- Combination with other tools: It’s levels can be used with other technical analysis tools, like trend lines and moving averages, to provide a complete picture of an asset’s price action.
Disadvantages of Fibonacci retracement:
- Lack of accuracy: It levels are not exact predictors of an asset’s price and should not be relied upon as a sole indicator.
- Not a standalone tool: Those retracement levels should be used simultaneously with other technical analysis tools and a sound trading strategy.
- Price can violate levels: The asset’s price can violate the predicted retracement levels, making it unreliable in certain market conditions.
How do you use Fibonacci retracement?
Step 1: Identify the Trend – The first step in trading with Fibonacci retracement is to identify the trend of the asset you are trading. This can be done by looking at the price chart and determining if it is in an uptrend, downtrend, or trading range. If the asset is in an uptrend, you will want to focus on the potential areas of support, while in a downtrend, you will want to focus on possible areas of resistance.
Step 2: Plot the High and Low – Once the trend has been identified, the next step is plotting the price moves high and low. These points are used as the basis for calculating the Fibonacci retracement levels.
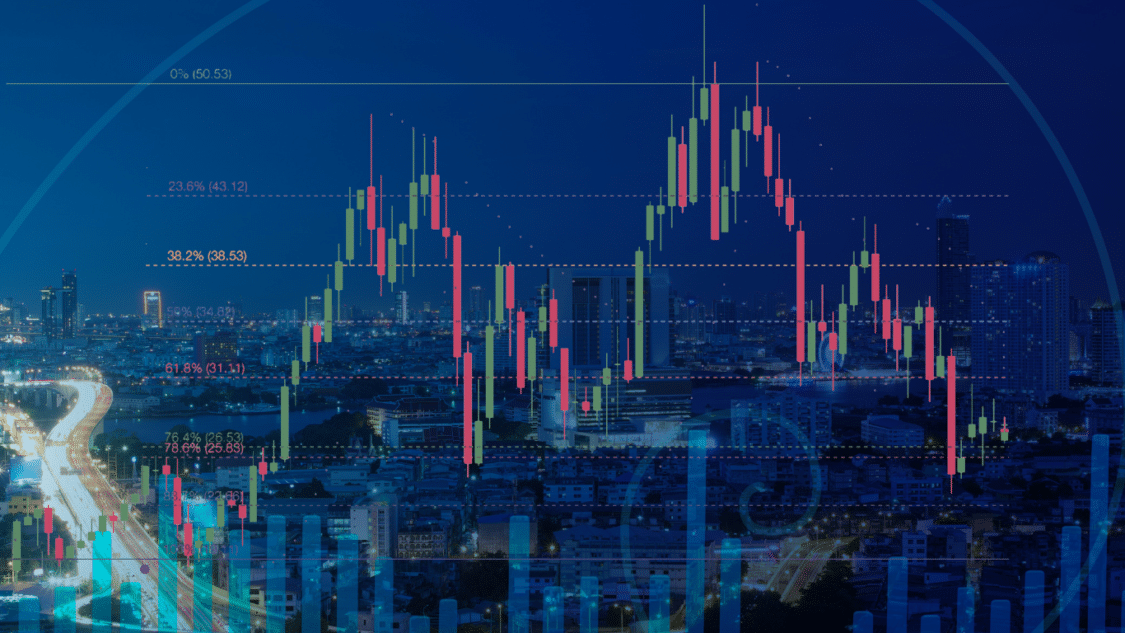
Step 3: Calculating the Fibonacci Retracement Levels – The vertical distance between the high and low points of the asset’s price movement is divided by key Fibonacci ratios, including 23.6%, 38.2%, 50%, 61.8%, and 100%, to determine this retracement lines. Horizontal lines are then drawn at these levels to identify potential support and resistance areas.
Step 4: Look for Confirmations – Once those levels have been determined, it’s essential to look for confirmation that the asset’s price may indeed find support or resistance at these levels. This can be done by looking at other technical analysis tools, like trend lines and moving averages, to determine if they align with the Fibonacci retracement levels.
Step 5: Enter a Trade – Once you find the potential area, the next step is to enter a trade. This can be done by placing a stop-loss or limit order at the desired price level.
By following these steps, traders can effectively use Fibonacci retracement to identify potential support and resistance areas in an asset’s price movement.
In conclusion, Fibonacci retracement is a powerful tool for traders and investors, and its origins can be traced back to the work of the Italian mathematician Fibonacci. Although he did not invent this tool himself, his introduction of the Fibonacci sequence and the concept of the golden ratio have had a significant impact on finance and the development of technical analysis tools.
What are non-fungible token stocks