Heikin Ashi is a candlestick chart commonly used in technical analysis to provide a clearer view of price action in financial markets. Unlike traditional candlestick charts, the Heikin Ashi strategy elaborates on the price movements by considering the open, close, high, and low prices for a given period. The resulting chart can help traders to identify trends and make more informed trading decisions.
How to trade using Heikin Ashi charts?
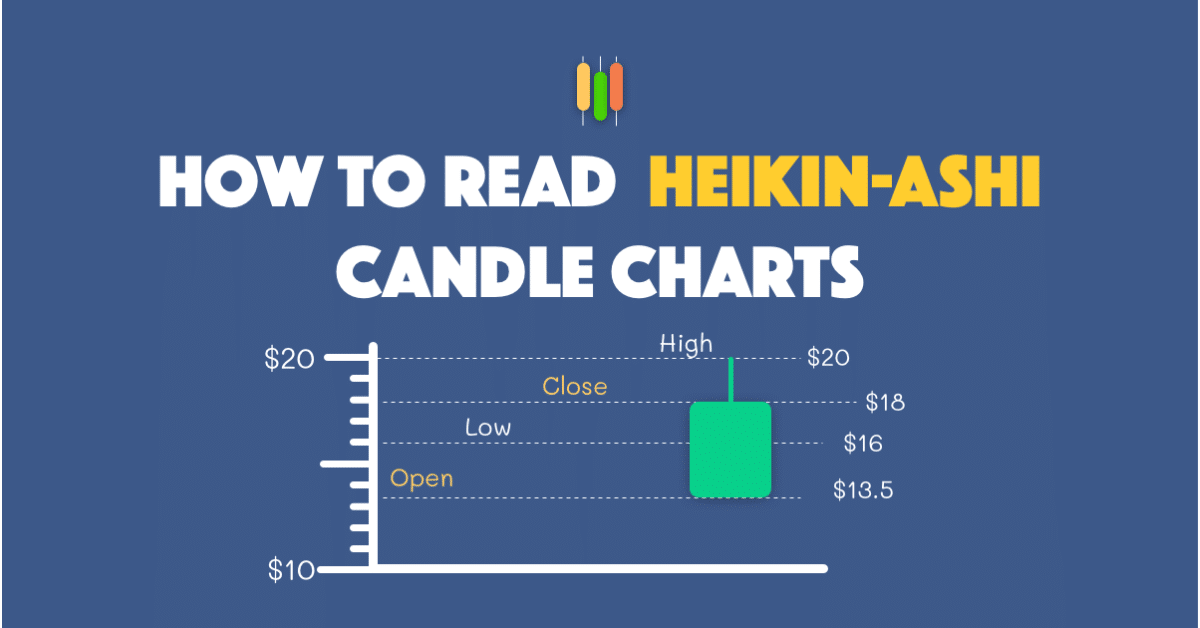
- Understanding: The first step to trading with Heikin Ashi is understanding how the chart is constructed. Unlike traditional candlesticks, the Heikin Ashi chart calculates the security’s average price over a given period, using the open, close, high, and low prices. This creates a smoother representation of price action that can help to identify trends and support and resistance levels.
- Identifying Trends: One of the key benefits of using this is that it can help traders to identify trends more quickly. The chart uses a color-coding system, with bullish candles represented in green and bearish candles represented in red. A series of green candles suggests an upward trend, while a series of red candles suggest a downward trend.
- Trading with Heikin Ashi Strategy: Once you have identified a trend using the chart, you can use this information to make trades. If you believe the trend will continue, you can place a long (buy) trade. Conversely, you can place a short (sell) trade if you believe the trend will reverse.
- Using Support and Resistance: Heikin Ashi charts can also be useful in identifying support and resistance levels. When the price hits a support level, it is likely to bounce back up, while a resistance level is likely to limit further upward price movement.
- Incorporating Other Indicators: While this can be a useful tool, it is often used in conjunction with other technical indicators to provide a more rounded picture of the market. For example, traders may use moving averages, trend lines, or oscillators to confirm signals generated by the Heikin Ashi chart.
How to read the Heikin Ashi chart?
Reading the chart is similar to reading a traditional candlestick chart, with a few key differences. The following are the steps to reading the chart:
- Color coding: The first step to reading the chart is understanding the color coding system. Green candles indicate a bullish trend, while red candles indicate a bearish trend.
- Identifying trends: To identify trends in a Heikin Ashi chart, look for sequences of green or red candles. A series of green candles reveals an upward trend, while a series of red candles indicate a downward trend.
- Support and resistance levels: The charts can also help traders identify support and resistance levels. When the price hits a support level, it is likely to bounce back up, while a resistance level is likely to limit further upward price movement.
- Candlestick patterns: Candlestick patterns can also provide valuable information about market sentiment. For example, a bullish reversal pattern, such as a hammer or a bull reversal, can indicate that a bearish trend is coming to an end and a bullish trend is about to begin.
- Incorporating other indicators: While this is a helpful tool on its own, it is recommended to use it together with other technical indicators. This provides the trader with a solid picture of the market.
By following these steps, traders can effectively read a chart and use it to make more informed trading decisions. It is important to note that Heikin Ashi should be used in conjunction with other technical analysis tools and not relied upon as the sole source of information for trading decisions.
What’s the difference between Heikin Ashi and candlesticks?
Heikin Ashi and Japanese candlesticks are two different charts used in technical analysis to display price information for financial assets. Here are the key differences between the two:
- Calculation Method: Heikin Ashi charts use a different calculation method than Japanese candlesticks. Japanese candlesticks display the difference between the opening and closing price for a given time period. At the same time, Heikin Ashi takes into account the average of the open, close, high, and low prices for a given period. This creates a smoother representation of price action and can help to identify trends more quickly.
- Color Coding: Heikin Ashi charts use a color-coding system, with bullish candles represented in green and bearish candles represented in red. This makes it easier to identify trends and make more informed trading decisions.
- Smoothing Effect: Heikin Ashi charts have a soothing effect on price action, making it easier to identify trends and support and resistance levels. This can be particularly helpful in markets where prices are volatile or subject to sudden spikes or drops.
- Confirming Trends: While both the Heikin Ashi strategy and Japanese candlesticks can be used to identify trends. Heikin Ashi can be more effective in confirming trends. A series of green or red candles on a Heikin Ashi chart provides a more precise signal of a trend, as it takes into account the average price rather than just the opening and closing prices.
Heikin Ashi and Japanese candlesticks are useful tools for technical analysis, but they have different strengths and weaknesses. Traders may choose to use both types of charts together or prefer one over the other, depending on their personal preferences and trading style.
What are the advantages of Heikin Ashi?
- Improved Trend Identification: Heikin Ashi charts provide a smoother representation of price action and can make it easier to identify trends, as they take into account the average price over a given period. This makes it easier to identify whether prices are moving up or down and can help to confirm trends.
- Reduced Noise: The smoothing effect of these charts is that they can help to reduce the impact of price noise, such as sudden spikes or drops in prices, making it easier to focus on the underlying trend.
- Better Support and Resistance Levels: Heikin Ashi charts can help traders identify support and resistance levels more effectively, providing a clearer picture of price action. This can be useful in making more informed trading decisions.
- Color-Coding System: These charts use a color-coding system, with bullish candles represented in green and bearish candles represented in red. This makes it easier to identify trends and can help traders make more informed decisions.
- Reduced False Signals: Heikin Ashi charts can reduce the number of false signals generated by traditional candlestick charts, as they provide a smoother representation of price action. This can help traders avoid unnecessary trades and improve their overall trading performance.
What are the disadvantages of Heikin Ashi?
- Late Signals: One of the main disadvantages of Heikin Ashi charts is that they can generate late signals compared to traditional candlestick charts. This is because these charts smooth out price action, which can result in signals appearing later than they would on a traditional candlestick chart.
- Less Precision: Because Heikin Ashi charts smooth out price action, they may provide less precise signals than traditional candlestick charts. This can make it more challenging to identify short-term price movements and may result in missed opportunities for traders.
- Dependence on Other Indicators: While Heikin Ashi charts can be useful in identifying trends and support and resistance levels, they may need to provide more information on their own. Traders often use Heikin Ashi and other technical indicators, like moving averages or oscillators, to provide a more complete market picture.
- Limited Use for Day Trading: Heikin Ashi charts may be less effective for day traders, as they provide a smoothed representation of price action that may not capture short-term price movements.
Is Heikin Ashi reliable?

Heiken Ashi, like any technical analysis tool, is not a guarantee of future market performance or a reliable indicator of market trends. It can be useful in identifying trends and making informed trading decisions, but it should not be relied upon as the sole source of information.
It is important to use Heiken Ashi charts in conjunction with other market analysis techniques, such as fundamental analysis and market sentiment, and to consider the impact of broader market and economic conditions. Additionally, traders should be aware of the limitations of Heiken Ashi charts, such as late signals and limited use for day trading.
In conclusion, This is a useful tool for traders who are looking for a clearer representation of price action in financial markets. By understanding how the chart is constructed, identifying trends, and incorporating other technical indicators, traders can use the Heikin Ashi strategy to make more informed trading decisions.