Candlestick charts have been used for centuries as a powerful tool in technical analysis. They provide traders with valuable insights into market sentiment and price action. One of the most well-known candlestick patterns is the Doji candle pattern. In this guide, we will delve into the intricacies of the Doji candle pattern and explore various strategies to master its art in reading and trading.
What is the Doji Candle Pattern?
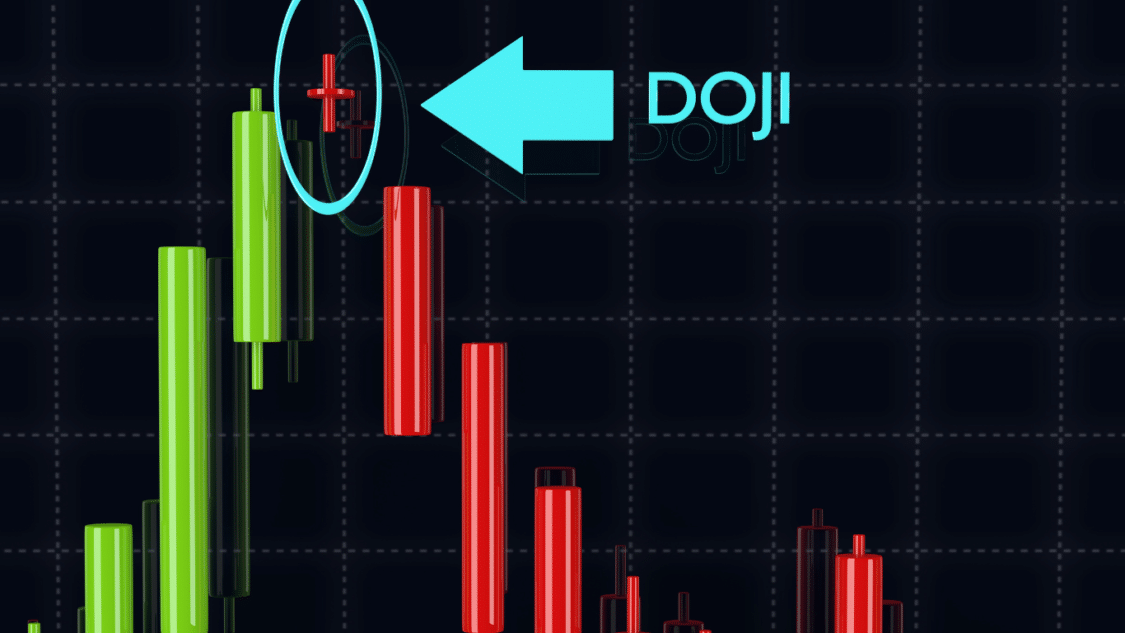
The Doji candle pattern is characterized by its unique shape, where the opening and closing prices are almost the same or very close together. This results in a small or nonexistent body, with the upper and lower shadows of equal or varying lengths. The candle represents market indecision, signalling that buyers and sellers are in equilibrium.
The Doji candle pattern holds significant importance in the world of technical analysis. It signifies a state of equilibrium between buyers and sellers, suggesting a potential trend reversal or continuation. The Doji candle often acts as a reversal signal when it appears after a long uptrend or downtrend. It implies the current trend is losing strength and that a reversal is inevitable.
Types of Doji Candles:
The Doji candle pattern has several variations, each with its own characteristics and implications. The most common types include the Standard Doji, the Long-Legged Doji, the Gravestone Doji, the 4 Price Doji and the Dragonfly Doji.
Standard Doji Pattern
The standard Doji pattern is a single candlestick that, on its own, provides little information. To understand its significance, traders need to observe the prior price action leading up to it. A standard Doji may indicate a continuation of the trend in an uptrend. However, it’s essential to confirm this through additional research.
Long-Legged Doji
The long-legged Doji is characterized by a more significant extension of the vertical lines above and below the horizontal line. This indicates that the price action experienced substantial fluctuations during the timeframe but closed at a similar level to the opening price. The long-legged Doji represents a state of indecision between buyers and sellers.
A long-legged Doji often signifies a retracement after a strong move in the opposite direction. Traders can interpret this as a potential change in direction and look to enter a trade in the direction opposite to the retracement. For example, if the Doji represents the top of a retracement in a downtrend, traders may consider shorting the asset at the opening of the next candle after the Doji. Placing the stop loss at the top of the upper wick on the long-legged Doji can help manage risk.
Dragonfly Doji
The Dragonfly Doji appears at the top or bottom of a trend. It is characterized by a ‘T’ shape, with no line above the horizontal bar. This indicates that prices did not move above the opening price. When the Dragonfly Doji appears at the bottom of a bearish move, with an extended lower wick, it signals a potential bullish reversal.
Traders should pay close attention to the Dragonfly Doji as it suggests a shift in market sentiment. It indicates that buyers are stepping in and potentially reversing the downtrend. Confirmation is an important step before entering a trade through this pattern.
Gravestone Doji
The Gravestone Doji forms when opening and closing prices are at the lower end of the trading range, which is the opposite of the Dragonfly Doji. It signifies a bearish signal, indicating that buyers could not sustain the bullish momentum. The Gravestone Doji often appears at the top of an uptrend, suggesting a likely reversal.
When traders encounter a Gravestone Doji, they should be cautious about the potential of a trend reversal. It indicates that sellers might be gaining control and pushing the price down. To confirm the reversal, traders can analyze additional indicators and price action.
4 Price Doji
The 4 Price Doji is the unique pattern in this list. It represents the ultimate market indecision, characterized by a horizontal line with no vertical lines above or below it. The high, low, open, and close prices are identical, signifying extreme uncertainty or a highly quiet market.
Traders should be cautious when encountering a 4 Price Doji, as it suggests that neither buyers nor sellers control the market. It indicates a state of equilibrium and often precedes significant price movements. Additional analysis and confirmation are essential before trading based on this pattern.
Factors to Consider:
When trading the Doji candle pattern, consider the following factors that can influence its significance.
- First and foremost, the context in which the Doji candle appears is crucial. If it occurs after a strong uptrend or downtrend, it carries more weight and is likely to be a significant reversal signal.
- Secondly, the volume during the formation of the Doji candle is important. Higher volume strengthens the validity of the pattern.
- Lastly, analysing the overall market conditions and other technical indicators is crucial to confirm the Doji candle’s implications.
How to Trade the Doji Candlestick?
Trading this requires a systematic approach and a keen understanding of market dynamics. One popular strategy is to wait for confirmation after the appearance of a Doji candle. This can be a subsequent candle closing in the opposite direction or a breakout above or below the Doji’s high or low. Another strategy is to use the Doji candle as a signal to exit an existing position or tighten stop-loss orders. This ensures that traders protect their profits or limit potential losses.
Doji Star Pattern:
The Doji star pattern is a variation of the Doji candle pattern that is particularly significant in identifying potential trend reversals. It consists of a Doji candle followed by a larger candle that gaps in the opposite direction. This pattern indicates a sudden shift in market sentiment and often precedes a substantial price move. Traders can use the Doji star pattern to enter new positions or close existing ones.
Dragonfly Doji in Trend Trading:
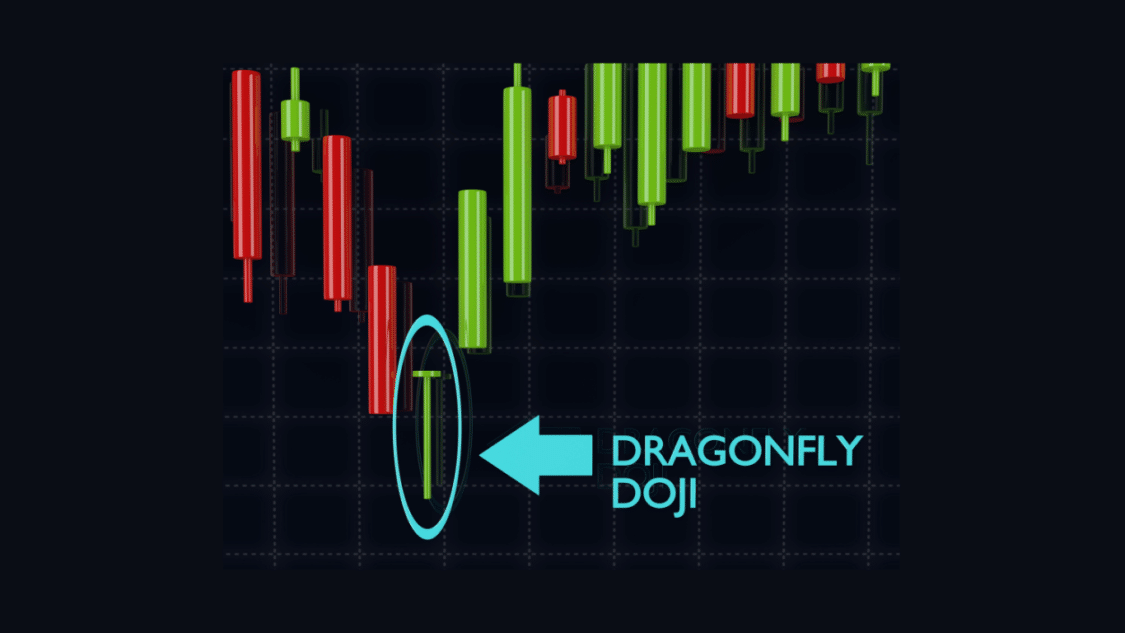
The Dragonfly Doji is a bullish variation of the Doji candle pattern. It is characterized by a long lower shadow and a nonexistent or very small upper shadow. This pattern usually occurs at the bottom of a downtrend and suggests a potential trend reversal. Traders can use the Dragonfly Doji as a signal to enter long positions or as confirmation to hold onto existing long positions.
Double Doji Strategy:
The Double Doji strategy is a powerful technique that combines two consecutive candles to identify potential trend reversals. This strategy requires patience and careful observation. When two Doji candles appear consecutively, it indicates a prolonged period of indecision in the market. Traders can use this pattern to anticipate a significant price move and position themselves accordingly.
Mistakes to Avoid:
While trading the Doji candle pattern, avoid these common mistakes that can lead to potential losses. One common mistake is to rely solely on the Doji candle without considering other technical indicators or market conditions. Using this candle as part of an intricate trading strategy is essential. Another mistake is entering trades immediately after a Doji candle’s appearance without awaiting confirmation. Patience and confirmation are key to successful trading using the Doji candle pattern.
How do you read a doji pattern?

To master the art of reading and trading the Doji pattern, it is essential to develop certain techniques. Firstly, practice observing and identifying different variations of the Doji candle pattern on historical charts. This will help train your eyes to spot these patterns in real-time trading. Secondly, study the relationship between the Doji candle pattern and other technical indicators, such as moving averages or support and resistance levels. This will provide a more comprehensive understanding of market dynamics and increase the accuracy of your trades.
Is a doji and spinning top candle the same thing?
A doji and a spinning top candle are not the same. Although they share the similarity of being an indecision candle, they also show a balance between buyers and sellers. They have some differences in their shape and significance.
The open and closing prices are the same or very close when a candle is doji, which has a small body or none. The fact that the upper and lower shadows are long or equal indicates that the price moved widely in both directions before settling close to the open. Depending on the context and confirmation, a doji can suggest a trend reversal or continuation and denotes a state of equilibrium or neutrality in the market.
A spinning top candle has a broader body than a doji, indicating that the open and closing prices differ somewhat. Additionally, it contains extensive upper and lower shadows, indicating that the session saw a lot of price volatility. Depending on the context and confirmation, a spinning top candle might signify a state of market uncertainty or a trend reversal or continuance.
The primary difference between a doji and a spinning top is that a doji shows that the market is completely balanced, while a spinning top indicates some imbalance or uncertainty. A doji, as opposed to a spinning top, indicates that the market is ready for a shift and that the prior trend has lost pace. A spinning top indicates that the prior trend still has some power and that the market is not yet ready to turn and is more likely to signal a continuation than a doji.
Conclusion:
The Doji pattern is a powerful technical analysis tool that provides vital insights into market sentiment and potential trend reversals. By understanding the different types of Doji candles and their implications, traders can make informed decisions and improve their trading outcomes. However, it is essential to consider various factors, avoid common mistakes, and develop effective techniques to trade the Doji pattern successfully. With practice and experience, mastering the art of reading and trading the Doji candle pattern can become a valuable skill for any trader.