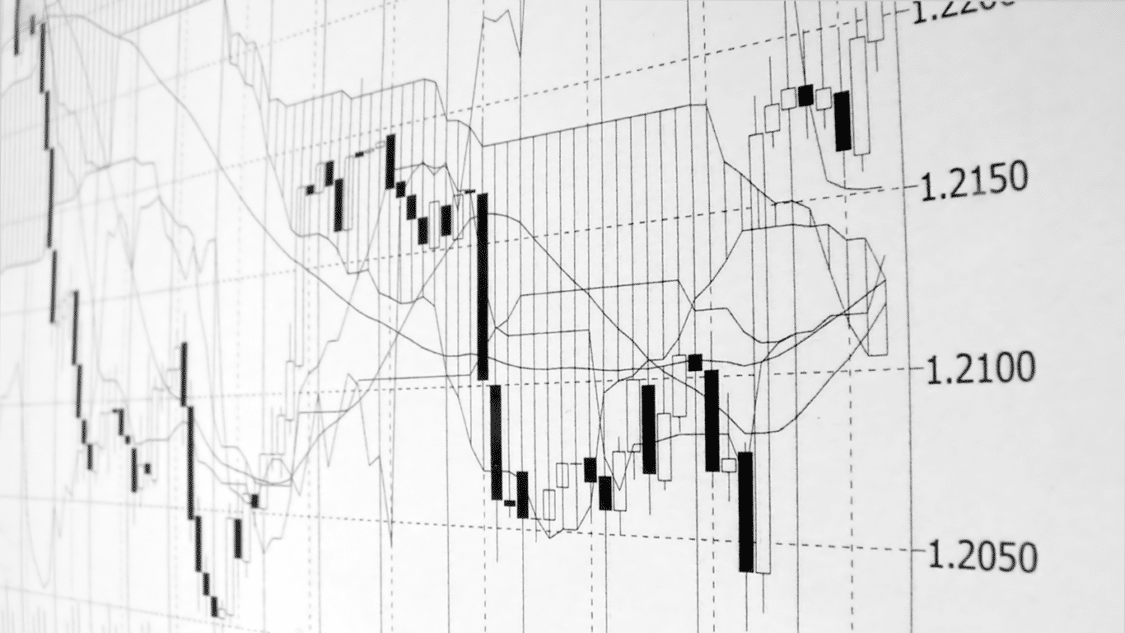
Forex candles, also known as Japanese candlesticks, are a popular chart used by traders to visualize the price movement of currency pairs. The candlesticks are named after the Japanese technical analysis method, dating back to the 1700s. Steve Nison later popularized the method in his 1991 book, “Japanese Candlestick Charting Techniques.”
Where did the name originate from?
Japanese candlesticks got their name because they originated in Japan, where rice traders first used them in the 1700s. As we mentioned above, the technique was later adopted by Japanese financial traders. Eventually, it spread to the West through the work of Steve Nison, who popularized the method in his book “Japanese Candlestick Charting Techniques.”
The use of candlesticks as a method of technical analysis has a long history in Japan. It was initially developed for rice traders to represent price movement visually. The technique was later adapted for financial markets and has become a popular tool worldwide among traders and investors.
How do you read Japanese candlesticks?
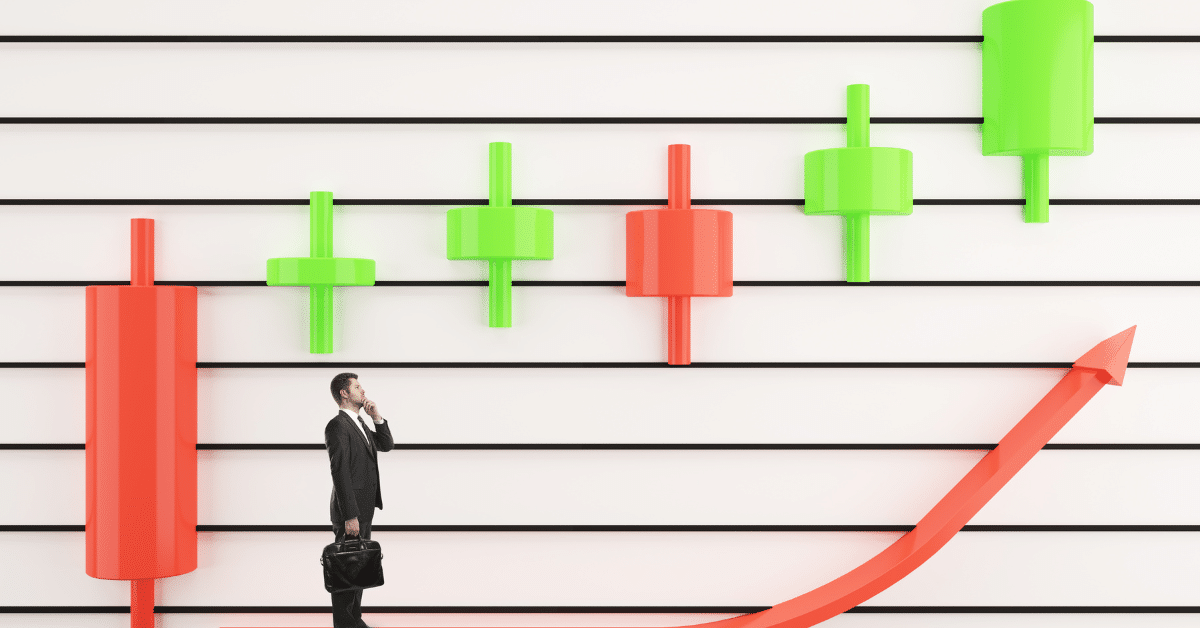
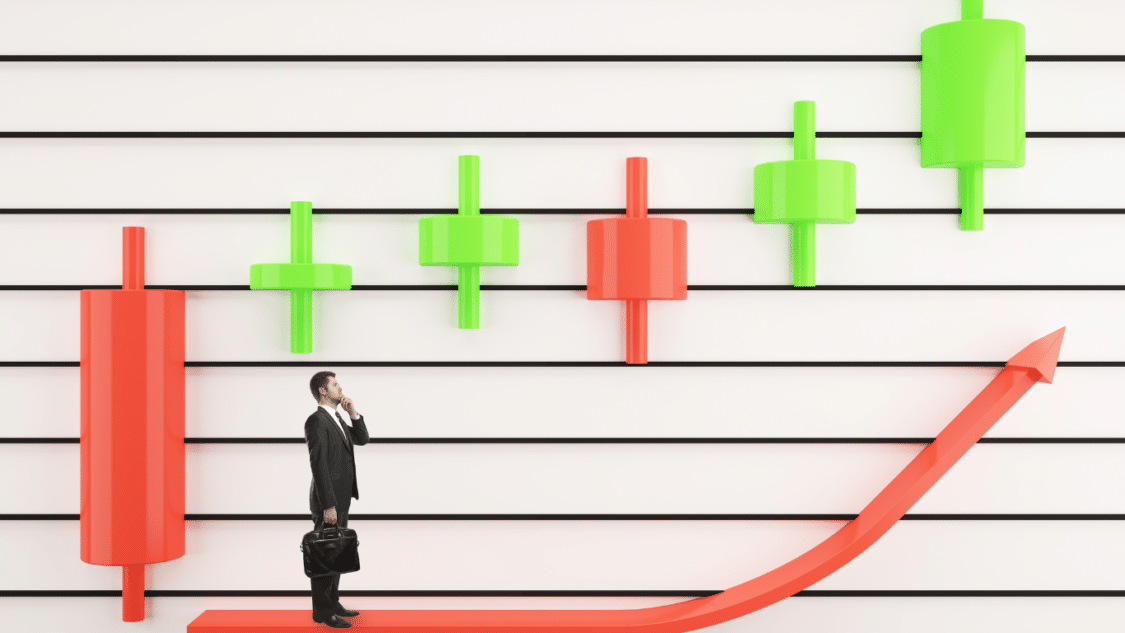
A single forex candle represents a single day of price action, displaying the opening, high, low, and closing prices. The candle’s real body, which is the shaded portion between the opening and closing price, shows the difference between the opening and closing price. The upper and lower wicks, also known as shadows, show the high and low prices for the day.
The color of the real body can be either green or red, with green signifying a bullish trend (where the closing price is higher than the opening price) and red signifying a bearish trend (where the closing price is lower than the opening price).
What is a candlestick pattern cheat sheet?
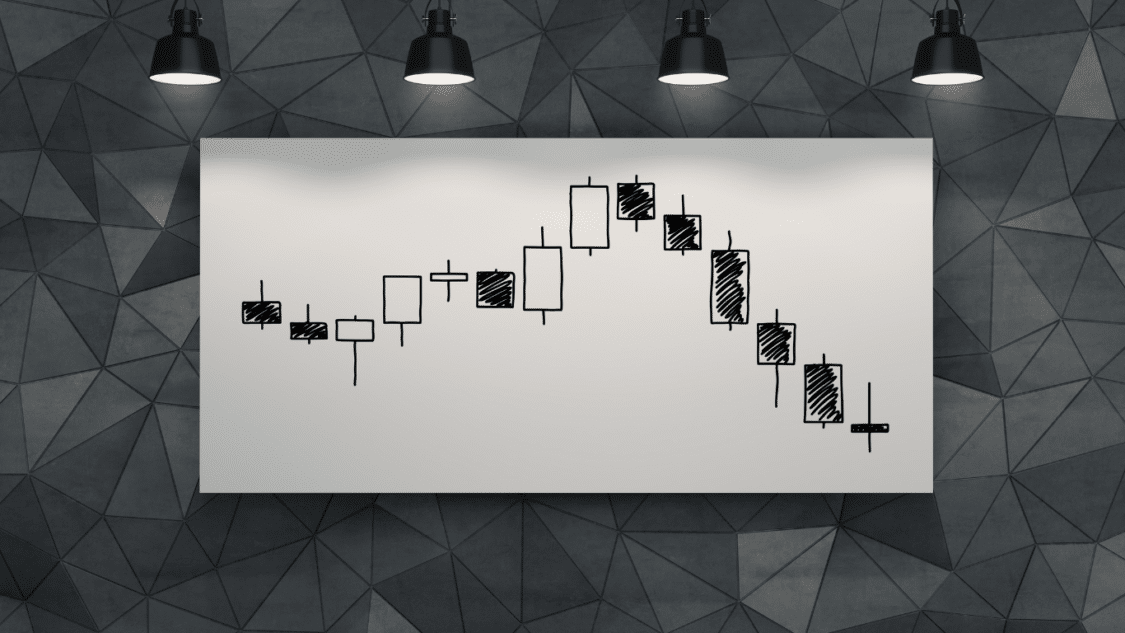
A candlestick patterns cheat sheet is a reference guide that lists the market’s most commonly used candlestick patterns, along with a brief description of each pattern and its potential significance for traders.
These patterns can be used to analyze market trends and identify potential trading opportunities. A cheat sheet can be helpful for traders who are just starting out or experienced traders who want to reference the most important patterns quickly. Some common patterns include the hammer, doji, shooting star, and more.
What do the Japanese candlestick patterns mean?
- Hammer: a bullish reversal pattern that consists of a small real body and a long lower shadow.
- Doji: a pattern that occurs when the opening and closing prices are the same or nearly the same, indicating indecision in the market.
- Shooting Star: A bearish reversal pattern that consists of a small real body, a long upper shadow, and little or no lower shadow.
- Bullish Engulfing: A bullish reversal pattern that occurs when a small red candle is followed by a large green candle, where the green candle completely engulfs the red candle.
- Bearish Engulfing: A bearish reversal pattern occurs when a small green candle is followed by a large red candle, where the red candle completely engulfs the green candle.
It is important to note that candlestick patterns can provide valuable information. They should be combined with other technical analysis tools for a comprehensive trading strategy.
Factors that made Japanese Candlesticks popular:
- Ease of Use: Japanese candlesticks provide a simple and intuitive way to visualize price movement, making it easier for traders to understand market trends and identify potential trading opportunities.
- Versatility: Japanese candlesticks can be used in various financial markets, including forex, stocks, futures, and commodities, making it a popular tool among traders.
- Integration with Other Technical Analysis Tools: Japanese candlesticks can be combined with other technical analysis tools, such as trend lines, moving averages, and oscillators, providing traders with a comprehensive approach to market analysis.
- Wide Availability of Resources: There is a wealth of information and resources available on Japanese candlesticks, including books, courses, and online resources, making it easy for traders to learn and apply the technique.
The popularity of Japanese candlesticks continues to grow, and the technique remains a widely used tool in the financial markets.
Closing Thoughts
In conclusion, forex candles, or Japanese candlesticks, provide traders with a visual representation of price movement over time. Understanding candlestick patterns and how to use them in combination with other analysis tools can greatly benefit traders in making informed trading decisions. A candlestick patterns cheat sheet can be a useful resource for traders looking to familiarize themselves with the most common patterns.
Heikin Ashi Strategy – All You Need to Know