As an investor or trader, you are undoubtedly aware that several tools and approaches are available to help you assess the market and make judgments. One of the most essential topics to understand is the distinction between leading and lagging indicators. In this article, we will define the two terms, explain how they can benefit your trading approach, and discuss some of the limits of technical analysis.
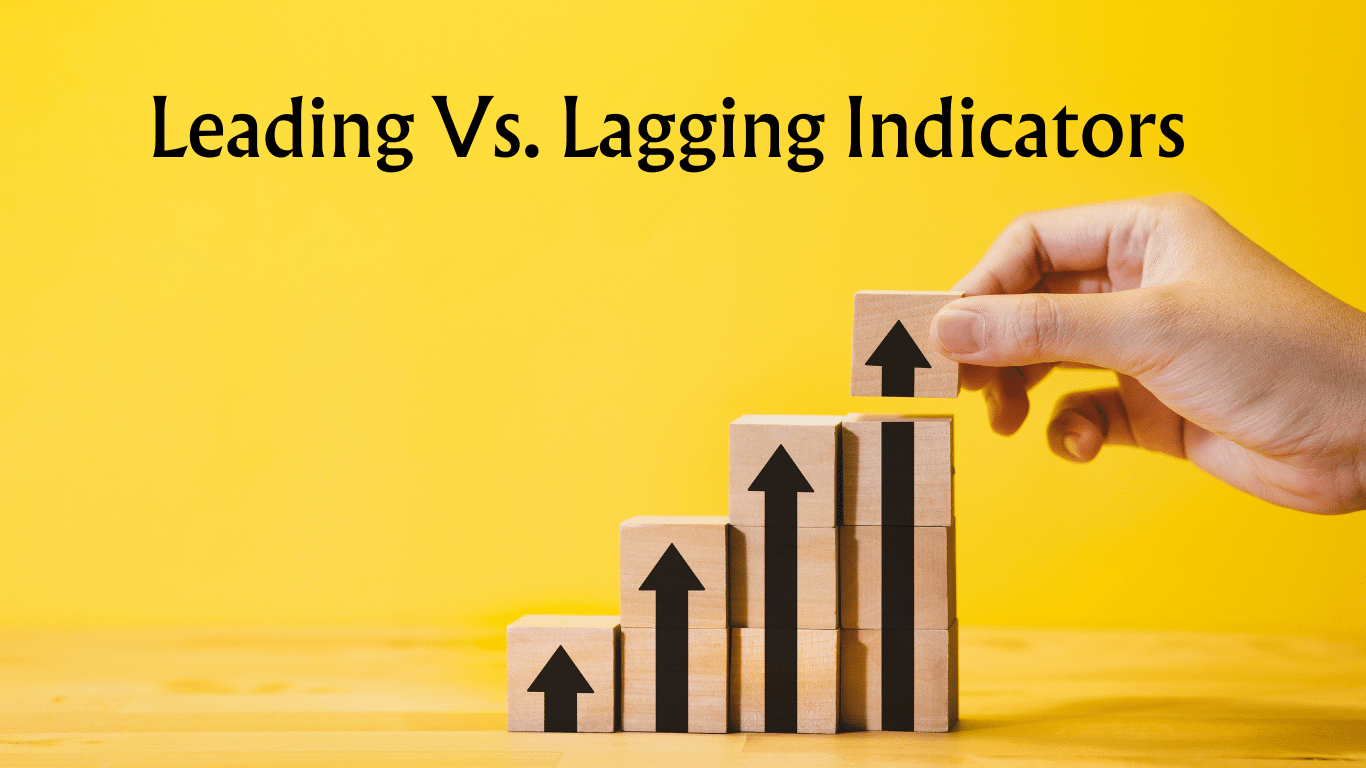
What are leading vs lagging indicators?
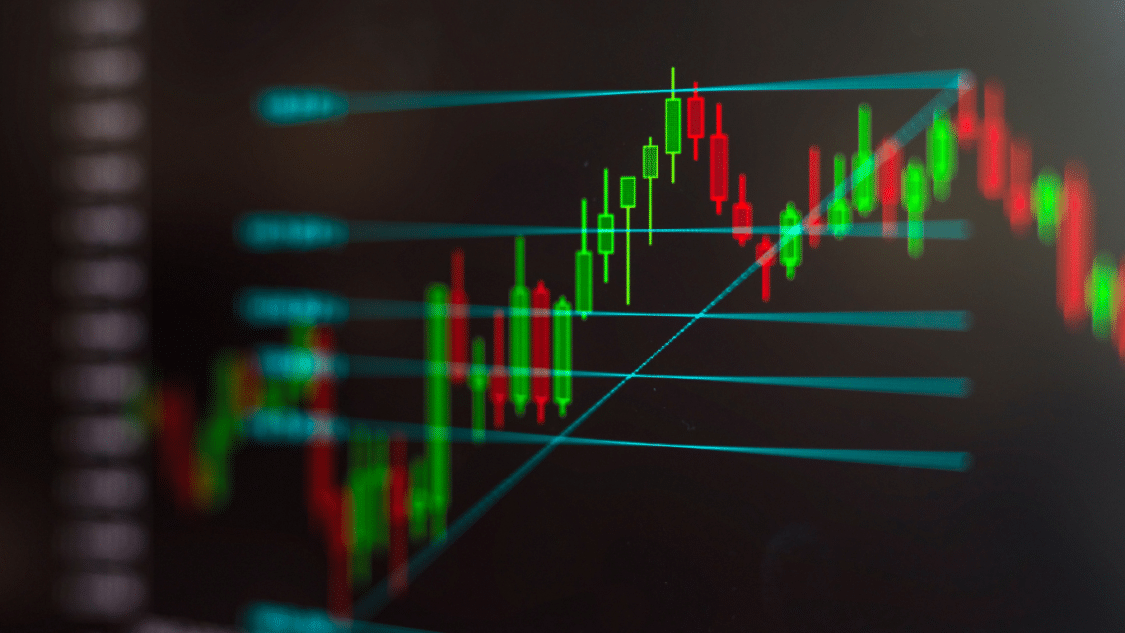
Leading vs lagging indicators are two standard indicator types that can help individuals assess the future or present market. These market metrics are often used together with technical analysis. This is a method of analyzing price movements in the market based on historical data and reoccurring patterns.
Leading indicators:
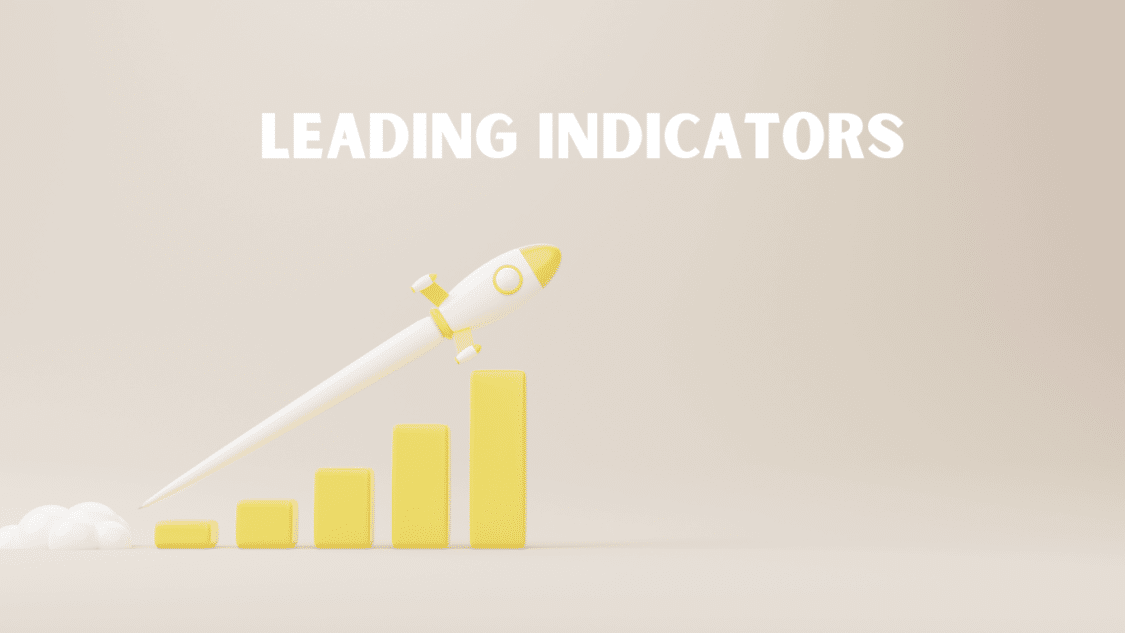
Leading indicators are measures that forecast or anticipate future trends or events. They are sometimes called inputs since they demonstrate which activities or variables might result in a desired outcome. They are valuable for detecting prospective opportunities or threats before they reveal themselves in price movement.
Some common examples of leading indicators are:
- Consumer confidence or sentiment: This measures consumers’ optimism and pessimism regarding the economy as a whole and their spending habits. Consumer confidence that is ranked high often indicates a high demand for goods which can, in turn, stimulate the stock market.
- Customer Satisfaction: Just as it sounds, this metric evaluates customers’ satisfaction with a particular product or service they receive. High customer satisfaction might imply a loyal client base, which can boost a company’s revenue and profitability.
- New product pipeline: This metric indicates the number of new items or services a firm produces or releases. A robust new product pipeline might suggest a competitive advantage and market development potential.
- New market growth: This metric reflects how quickly a corporation expands into new markets or geographies. The high new market growth might suggest revenue diversification and greater market share opportunities.
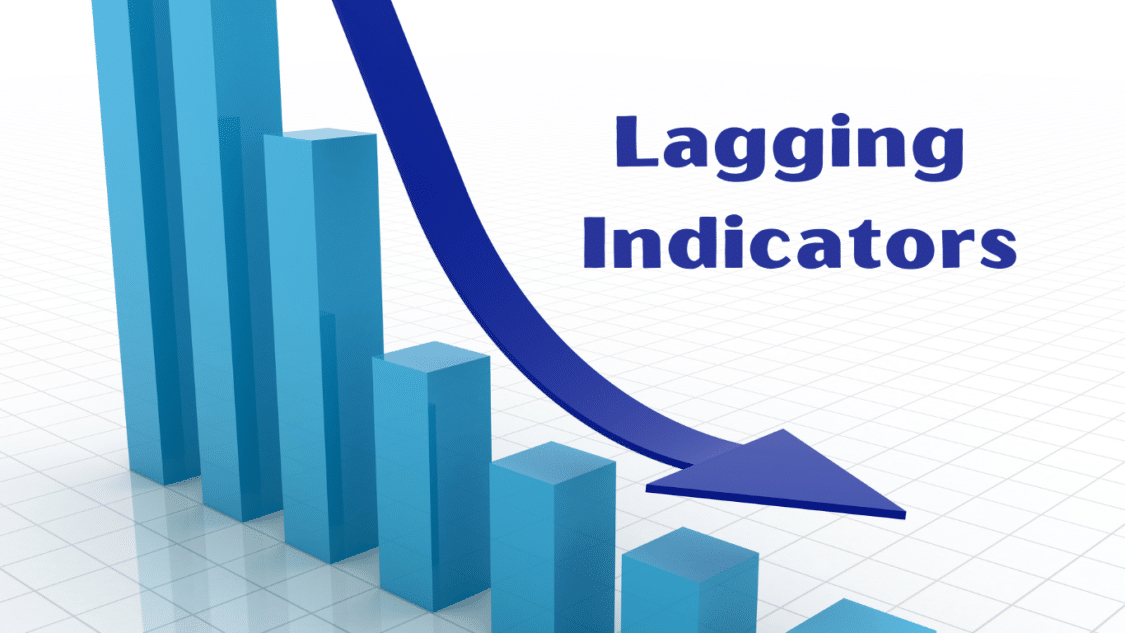
Lagging indicators:
Lagging indicators is a metric that mirrors or matches previous patterns or events. They are sometimes referred to as outputs because they demonstrate the outcomes or effects of previous activities. They are essential for assessing the efficacy or performance of a plan.
Some examples of lagging indicators are:
- Profit: this lagging indicator measures the sum the company has earned after deducting all expenses. A high profit usually indicates a successful business model and a solid financial position.
- Expenses: This metric measures how much a company has spent on various costs, such as production, marketing, salaries, etc. A low cost of operation might suggest an efficient process with a large profit margin.
- Customer participation: This metric measures the number of consumers that have purchased or utilized a product or service. A high level of consumer engagement might suggest a strong level of demand and a sizable market share.
- Renewal rates: This metric measures how many customers have renewed their contracts or subscriptions within the company. A high renewal rate can indicate customer satisfaction.
- Revenue: This metric measures how much income a firm has made by selling its goods or services. A significant revenue might suggest great sales success and a larger market size.
What is the difference between leading vs lagging indicators?
Leading vs lagging indicators are metrics that can assist in market analysis and trading choices. Leading indicators anticipate or predict future trends or occurrences, whereas lagging indicators reflect or confirm previous patterns or events. Consumer confidence, for example, is a leading indication that can reflect prospective demand for products and services. In contrast, profit is a lagging indicator that can reveal a company’s performance and profitability. Both indicators may be combined to gain insight into market conditions and trends.
How to use leading vs lagging indicators together?
Leading vs lagging indicators can be combined to gain a complete and comprehensive understanding of market conditions and trends. By combining both types of indicators, you can potentially:
– By using leading indicators, you can quickly identify prospective opportunities or threats before they become evident in price action.
– You can confirm or validate your assumptions or predictions based on price behaviour using lagging indicators.
– Using lagging indicators, you can adjust or refine your strategy or decision based on the feedback received.
For example, suppose you are trading software firm stocks. In that case, you may utilize leading indicators such as customer happiness, new product pipeline, and new market growth to forecast the company’s future demand and revenue. Lagging metrics such as earnings, costs, client involvement, and renewal rates can also be used to assess the company’s prior performance and profitability.
By analyzing both indicators, you may assess if the firm is undervalued or overvalued by the market and whether it has a high growth potential. This helps decide whether to purchase, sell, or keep the stock. To efficiently use both indicators, it’s essential to understand the strength and weaknesses of each.
Leading indicators can help you predict possible reversals or breakouts but can also provide erroneous or premature indications. Lagging indicators can help you validate a trend’s direction and intensity, but they can also be slow to react or miss key market swings.
A Common Combination Strategy:
As a result, a popular method is to utilize a combination of leading vs lagging indicators to filter out noise and improve signal dependability. For example, you may use a leading indicator like the RSI to identify overbought or oversold factors and then confirm a trend shift or continuance with a lagging indicator like the EMA. Alternatively, you may use a leading indicator, such as the MACD, to detect divergence or convergence between price and momentum and then use a lagging indicator, such as the OBV, to validate the volume behind the price change.
However, indicators are not foolproof and should be used together with other analysis methods, such as fundamental analysis, chart patterns, support and resistance levels, etc. Testing different indicators and settings to find the best work for your trading style and objectives is also important. There’s no full guarantee with any one indicator; always keep risk management techniques as our top priority and follow through with your trading plan.
Limitations of technical analysis:
While technical analysis is a powerful trading tool, it also has its share of limitations that investors should consider. Some of the limitations of technical analysis are:
– False signals: Technical analysis employs various mathematical and logical methods to provide indications for buying or selling. These signals, however, are not necessarily precise or reliable since market fluctuations, common mistakes, or manipulation can impact them. For example, technical analysis may indicate that the market would rise, but the market may fall instead owing to unforeseeable events or reasons.
– Analysts bias: Technical analysis is a subjective and personal art, not a fixed or objective science. Analysts may employ different methodologies, indications, or patterns to examine the same data, resulting in varying interpretations based on the same information. Furthermore, analysts may have personal preferences, ideas, or emotions that influence their analysis.
– Open to interpretation: Technical analysis is a suggested forecasting technique rather than a clear-cut or definitive way of predicting the market’s future. Depending on the setting, circumstance, or timeline, different approaches, signs, or patterns may have different interpretations, consequences, or probabilities. Furthermore, technical analysis does not give precise entry or exit points, but price movement ranges or zones.
– Ignores fundamentals: Technical analysis focuses on market price fluctuations and patterns while disregarding underlying variables that may influence the market. Technical analysis does not analyze a company’s or industry’s financial health, performance, or value, nor does it consider external events or variables that may impact the market. For example, technical analysis may miss the market effect of a significant news event, company report, or economic release.
Conclusion
Leading and lagging indicators are two metrics that can help you analyze the market and make efficient trading decisions. Leading indicators can help you anticipate or predict future trends or events while lagging indicators can aid in confirming or evaluating past trends or events. By combining both types of indicators, you can acquire a comprehensive understanding of market conditions and trends.
However, you should be aware of technical analysis’s limits, which is a way of projecting market movements based on previous data and trends. Technical analysis can produce misleading signals, be swayed by analyst bias, be vulnerable to interpretation, and disregard facts. As a result, you should be cautious when using technical analysis and augment it with other sources of information and analysis.