Introduction
In the fast-paced world of forex trading, timing is everything. Day traders and scalpers rely on precise execution and quick profits based on short-term market movements. To achieve success in this dynamic environment, traders often turn to technical indicators to identify support and resistance levels and make informed decisions. One such popular tool is the Fibonacci retracement, which can be effectively incorporated into a short-term scalping strategy.
In this article, we will explore and discover how Fibonacci levels can be utilized by scalpers on short-term charts to enhance their trading approach. We will cover the basics of Fibonacci retracements, the two main Fibonacci drawing tools, and common mistakes to avoid. By the end of this article, you will have a thorough understanding of how to use the Fibonacci scalper indicator to maximize your trading potential.
Understanding Fibonacci Scalper Indicator Levels
Before delving into the application of Fibonacci levels in scalping, it is essential to grasp the concept and significance of these levels. Fibonacci levels are derived from a special sequence of numbers introduced to the Western world by the Italian mathematician Leonardo of Pisa, popularly known as Fibonacci. These ratios or levels are widely used by traders, mathematicians, and scientists to identify potential areas of support and resistance in various fields.
In trading, the most commonly used Fibonacci ratios are 23.6%, 38.2%, 50.0%, 61.8%, 78.6%, and 100%. These levels are crucial in determining price retracements and extensions, enabling traders to anticipate possible turning points in the market. By incorporating Fibonacci levels into their analysis, traders gain valuable insights into the potential direction of future price movements.
The Fibonacci Retracement Tool for Trend Following
One way to leverage Fibonacci levels in scalping is by utilizing the Fibonacci retracement tool for trend following. This tool helps traders identify potential support and resistance levels during a trend, acting as magnets that attract prices towards them. By understanding the behavior of price around these levels, traders can determine optimal entry and exit points for their trades.
To apply the Fibonacci retracement tool effectively, traders need to select three key points on their charts. The first point represents the starting point of a trend, the second point is a swing high prior to a correction, and the final point is a higher low. These points are then used to calculate the Fibonacci extension levels, projecting them upward from the final point.
For example, let’s consider the EUR/USD currency pair on a four-hour chart. By applying the Fibonacci retracement tool to a recent major move, we can identify key inflections of support and resistance for the pair. These levels provide valuable insights into price action and can serve as potential entry and exit signals for scalpers.
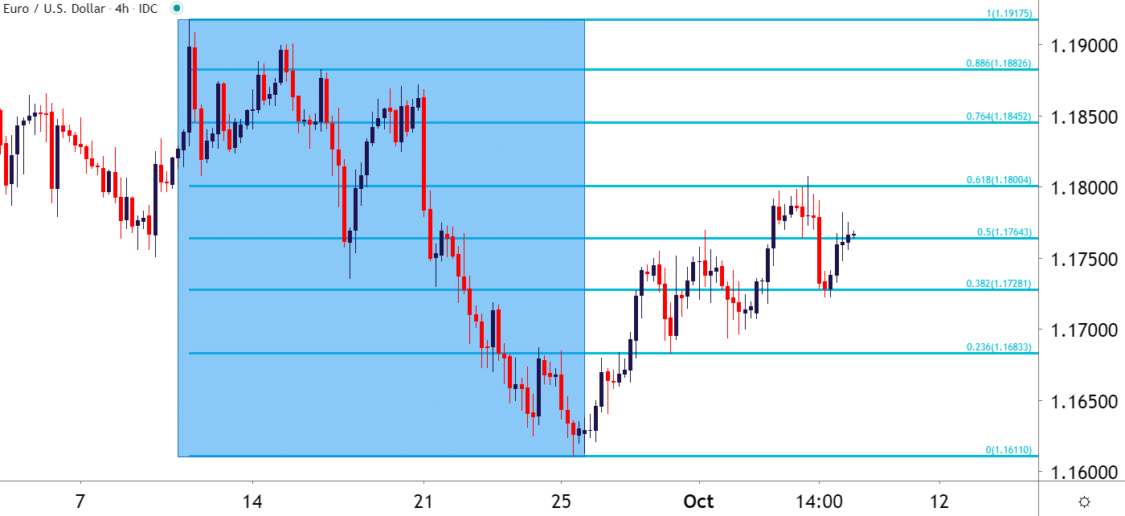
In the above chart, we can observe how the Fibonacci retracement levels from the move provided significant support and resistance points. Price action interacted with these levels, indicating potential turning points and opportunities for scalpers. By combining the Fibonacci levels with other technical tools like trendlines, traders can further enhance their analysis and increase the probability of successful trades.
Fibonacci Scalper Indicator for Counter-Trend Trading
In addition to trend following, Fibonacci retracement levels can also be applied to identify potential areas of support and resistance during counter-trend moves. While scalpers typically focus on short-term trends, incorporating Fibonacci retracement levels into their analysis can provide valuable insights for identifying reversals and trading opportunities.
To use the Fibonacci retracement tool for counter-trend trading, traders need to select two points on their charts. The first point should be an area where a previous correction ended, and the second point should be chosen as soon as a new counter-trend move starts. These two points are used to calculate the Fibonacci retracement ratios, providing levels at which counter-trend reversals may occur.
Let’s consider a downtrend in the EUR/USD currency pair on a 30-minute chart. By applying the Fibonacci retracement tool to this downtrend, we can identify potential levels of resistance where counter-trend corrections might end.
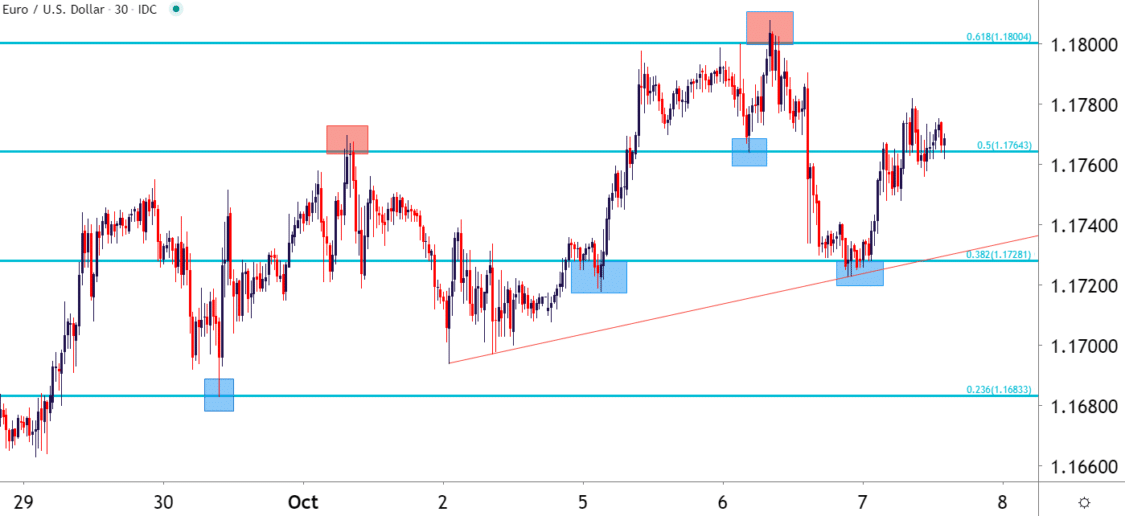
In the above chart, we can observe how price found resistance at the 61.8% Fibonacci retracement level on two separate occasions. This level acted as a turning point for the counter-trend move, indicating a potential opportunity for scalpers to trade with the main direction of the trend.
Traders could have entered long positions each time price pulled back and found support at the lower Fibonacci levels, using them as targets for profit-taking.In the above chart, we can observe how price found resistance at the 61.8% Fibonacci retracement level on two separate occasions. This level acted as a turning point for the counter-trend move, indicating a potential opportunity for scalpers to trade with the main direction of the trend. Traders could have entered long positions each time price pulled back and found support at the lower Fibonacci levels, using them as targets for profit-taking.
Common Mistakes to Avoid
While Fibonacci levels can be powerful tools for scalpers, it is crucial to avoid common mistakes that can lead to inaccurate analysis and poor trading decisions. Here are some key mistakes to avoid when using Fibonacci retracements:
- Mixing Reference Points
One common mistake traders make is mixing reference points when balancing Fibonacci retracements to price action. It is important to keep reference points consistent to ensure accurate analysis. For example, if you are referring to the lowest price of a trend through the closure of a session or the body of a candle, the best high price should be accessible within the body of a candle at the top of the trend.
Mixing reference points, such as going from a candle wick to the body of a candle, can lead to incorrect analysis and unreliable trading signals. To ensure consistency, apply Fibonacci retracements on a wick-to-wick or candle body-to-candle body basis.
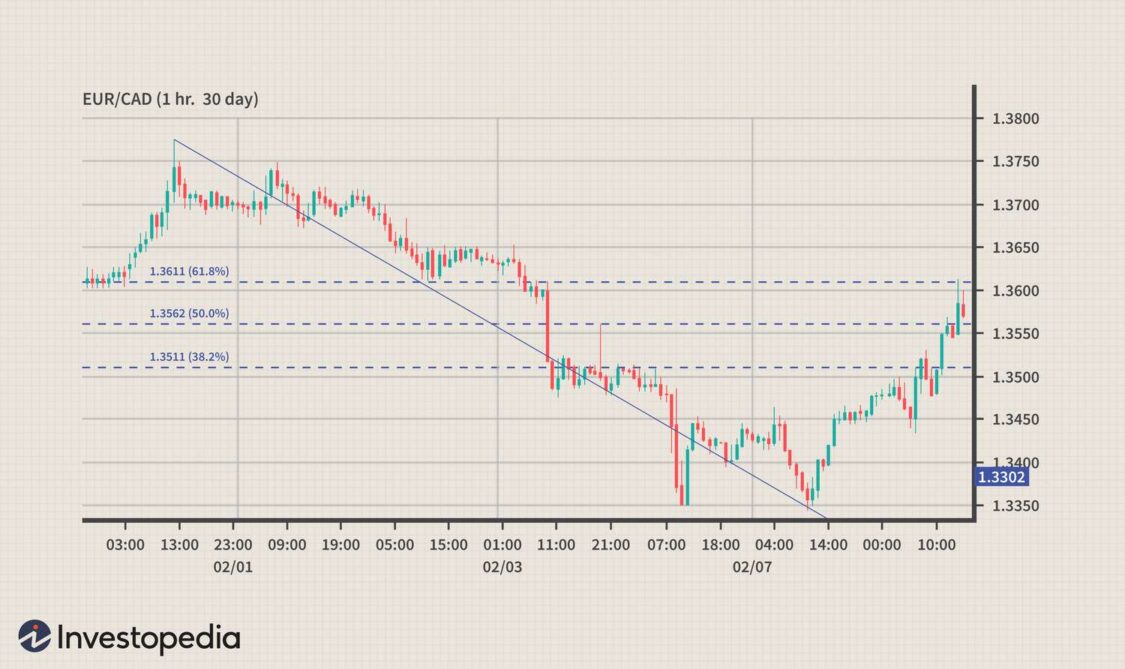
The image above demonstrates correct application of Fibonacci retracements on a wick-to-wick basis in the Euro/Canadian dollar currency pair.
- 2. Neglecting Long-Term Indications
New traders often have a myopic approach, focusing solely on short-term trends rather than considering long-term indications. While scalping involves capturing small price movements in any direction, it is important to understand the bigger picture. Long-term trends can provide valuable insights and serve as confirmation for scalping opportunities.
By incorporating long-term Fibonacci levels and trend analysis, traders can identify key support and resistance levels that align with their short-term trades. This holistic approach enhances the accuracy of scalping strategies and reduces the risk of making trades against the prevailing trend.
- 3. Overreliance on Fibonacci Levels
While Fibonacci levels can provide reliable trade setups, it is essential to rely on something other than them alone. Confirmation from other technical indicators and analysis tools is crucial to validate trading signals. Relying solely on Fibonacci levels without verification can result in false signals and poor trading decisions.
Traders should consider combining Fibonacci levels with other technical tools such as moving averages, oscillators, or chart patterns to strengthen their analysis. This multi-faceted approach provides a comprehensive view of the market and enhances the probability of successful scalping trades.
- 4. Neglecting Risk Management
One of the most common mistakes made by traders is poor risk management. This applies to scalpers even more, as they often execute a high frequency of trades. While scalping offers numerous trading opportunities, it also amplifies the potential risks.
During periods of high volatility, such as market gaps, the risk of substantial losses increases. Traders should always practice proper risk management techniques, including setting stop-loss orders and adhering to position sizing guidelines. Effective risk management is essential for long-term success in scalping and any trading strategy.
Conclusion
Fibonacci retracements are a powerful tool for scalpers looking to maximize their trading potential on short-term charts. By understanding and correctly applying Fibonacci levels, traders can identify key support and resistance levels, anticipate price movements, and make informed trading decisions.
Whether you are trend following or trading counter-trend moves, Fibonacci levels can provide valuable insights and serve as reliable trade setups. However, it is essential to avoid common mistakes such as mixing reference points, neglecting long-term indications, overreliance on Fibonacci levels, and neglecting risk management.
Remember, Fibonacci levels are just one piece of the puzzle. Combine them with other technical indicators, confirmatory analysis, and sound risk management techniques to develop a robust scalping on short-term charts strategy. With practice and experience, you can harness the power of the Fibonacci scalper indicator to achieve consistent profits in the dynamic world of forex trading.